2. Inbound Logistics
Inbound logistics include the receiving, warehousing, and inventory control of input materials.
Todo
How to retrieve the assets required to build the software : office files, requirements, images, web services definitions
2.1. Speech analogy for Data Vis
Source : https://classroom.udacity.com/courses/ud507/lessons/3063188874/concepts/30639889250923
Parts of speech are to sentences what visual encoding are to charts
POS::Sentences::visual encodings::charts
Parts of speech are composed of sentences
charts are composed of visual encodings applied to data types and combined with relationship between those data
Note
data types are continuous or categorical
dimensions are drawn in 1D, 2D, 3D
Geographic charts
choropleth = geographic + color
cartogram : geographix + size
dotmap : georgraphic + shape
2.1.1. The Lie factor
Lie factor describes the integrity of a graphic. if the lie factor is comprised within [0.95 < lie factor < 1.05] then the graphic representative of the data.
(2.1)¶![\text{Lie factor = }\frac{\text{size fo the effect shown in the graphic}}{\text{size of the effect shown in the data}} [0.95 < lie factor < 1.05]](_images/math/b32ea3972cf88f91dc700c4085b8b0e53f429423.png)
2.1.2. Separation of the visual elements and the structure of data
transform data without changing visual representation
allow for collaboration across teams
2.1.3. Grammar of the Graphics pipeline
d3.layout : applies common transformations on predefined chart objects
d3.nest : groups data based on particular keys and returns an array of JSON
d3.selection.attr : changes a characteristic of an element such as position or fill
d3.json : loads a data file and returns an array of Javascript objects
d3.selection.append : inserts HTML or SVG elements into a web page
d3.scale : converts data to a pixel or color value that can be displayed
2.1.4. Process
Pre-attentive processing : https://en.wikipedia.org/wiki/Pre-attentive_processing
Common chart types and how to choose a chart? https://youtu.be/xD2_AU6atqA
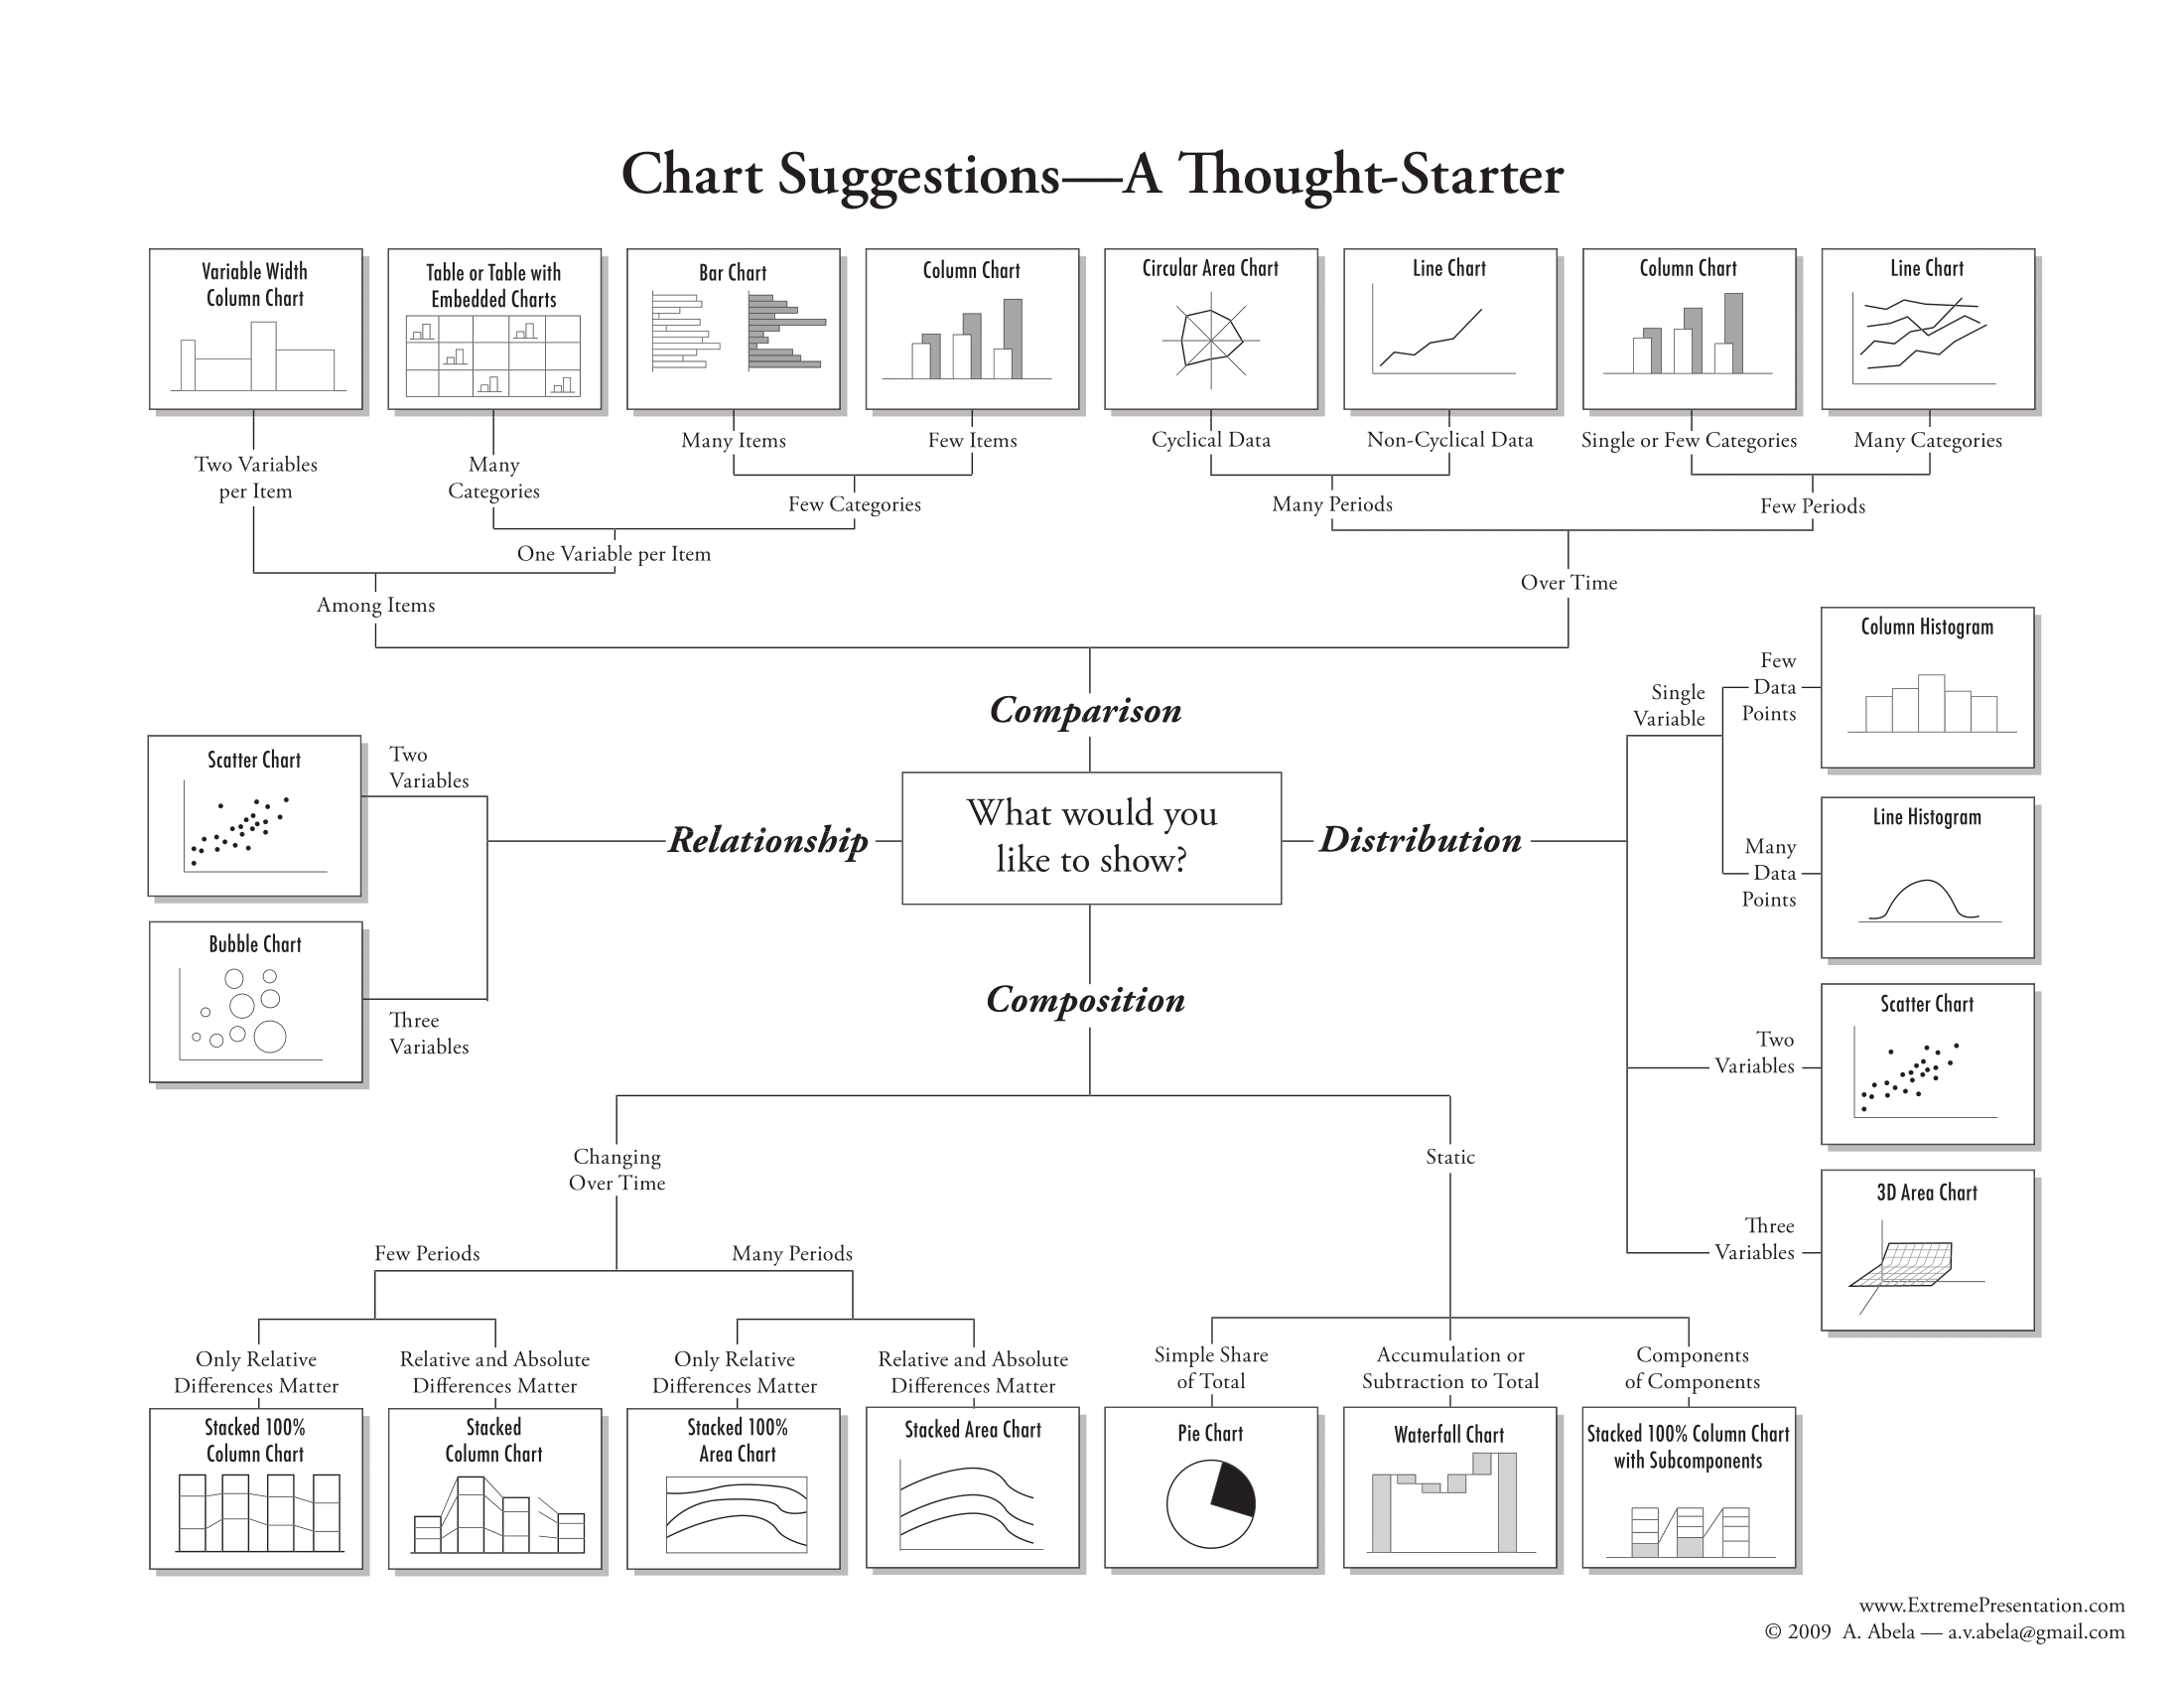
2.1.5. Choosing the right chart
Chart chooser tool : http://labs.juiceanalytics.com/chartchooser/index.html
Graph selection matrix : http://www.perceptualedge.com/articles/misc/Graph_Selection_Matrix.pdf
Visualization types : https://guides.library.duke.edu/datavis/vis_types
When to use stacked bar charts ? https://solomonmg.github.io/blog/2014/when-to-use-stacked-barcharts/
Box plots explained : http://www.physics.csbsju.edu/stats/box2.html
Selecting the Right Graph for Your Message by Stephen Few :
2.1.6. Choose free tools to draw charts
2.1.7. Reviziting the receipt
Source : https://twitter.com/DataToViz/status/1124752405973782528